Weather Watching: Did we have a LaNiña winter?
It’s long been regarded that the effects of El Niño and La Niña have a major effect on worldwide weather patterns and global climate. Extreme hot and cold climatic regimes, torrential rains and drought, and changes in ocean currents all translate into extreme weather conditions that globally impact our lives. In essence, La Niña is the polar opposite from El Niño and Fall and Winter of 2007/2008 are prime evidence of a global La Niña pattern.
The Pacific Ocean is the largest body of water on earth and its effects greatly influence global climate. Winds around the massive Pacific High Pressure Cell, in the northern hemisphere, flow clockwise around the ocean, or from north to south along North America’s West Coast; from east to west in the equatorial tropics (the Tropical Trade Winds); from south to north along Asia’s East Coast; and from west to east across the northern Pacific (the Westerlies).
The oceans are the earth’s heat collectors. In summer, the sun significantly warms the tropical ocean waters. Over the course of any given summer, this heat is collected and stored. As fall arrives, the ocean’s heat is distributed through ocean currents, which generally follow the clockwise wind patterns around the Pacific High Cell. This form of heat transfer is evident in all of the world’s oceans and is essential to maintain the equilibrium of our planet.
Ocean Currents
There are four dynamics working together that create our ocean currents: (1) heating from the sun, (2) circulation winds rotating around the oceanic High Pressure, (3) Coriolis force – from the rotation of the Earth, and (4) gravity.
Contrary to popular belief, the oceans are not flat or level. Dynamic forces tend to pile or push ocean levels higher in certain areas than others. Over the course of a summer, the Pacific equatorial waters off the Asian continent can be as much as 33 cm (13 inches) higher than the waters off the coast of South America.
El Niño is actually a weather phenomenon caused by the North Equatorial Current in the Pacific Ocean that “backwashes” warm equatorial waters from the tropical South Seas and Indo-China, eastward across the tropical Pacific, to the West Coast of South America. During certain summers, tropical ocean temperatures become heated warmer than normal because there is more sunlight – solar insolation – available to absorb.
Scientific evidence directly correlates El Niño and La Niña events to solar sun spot activity. Dr. James Lawler outlines this correlation in his1997 paper “A Correlation between Sun Spot Cycles and El Nino Events.” During those periods of large-scale solar activity – solar flares and dynamic sun spot activity — the sun emits massive amounts of solar radiation. These clouds of cosmic radiation propagate through space until they bombard earth’s atmosphere. The interaction disrupts communications, enhances the Aurora Borealis, and translates more solar energy for the tropical oceans to absorb. El Niño events directly correlate to maximum sun spot activity, while La Niña events directly link to minimum sun spot activity.
As fall brings shorter days and longer nights, the northern hemisphere’s oceans begin to cool. The Pacific High Cell shrinks northward and becomes smaller with less of an influence in the tropics. The associated tropical Westerlies become weaker and less evident. With less wind to circulate the west-to-east tropical ocean currents, the backwash of warm tropical waters propagates eastward where it meets the west coast of equatorial South America. This usually occurs near Christmas, thus the given name El Niño.
The resulting currents spread up and down the west coasts of both North and South America, reversing the natural coastal currents. The impact on the oceans, climate, and weather patterns worldwide and can be significant and devastating.
La Niña occurs when cooler-than-normal ocean surface temperatures are recorded in the tropical Pacific – during periods of less solar insolation absorbed by the ocean waters. As the cooler oceans backwash eastward toward South America during the Fall and Winter months, they also cool the regions along the coast and affect the inland regions of both North and South America. Colder than normal weather patterns result from this large-scale oceanic pattern that affects the global climate.
Looking at the fall 2007 and winter 2008 weather patterns along the West Coast of North America, the statistics indicate a moderate La Niña pattern. The map indicates the particular above normal/below normal temperature pattern by state, and indicates the severity of the cold over the last 113 years of weather records. Each state’s number ranks winter 2007/2008 compared to the past 113 years.
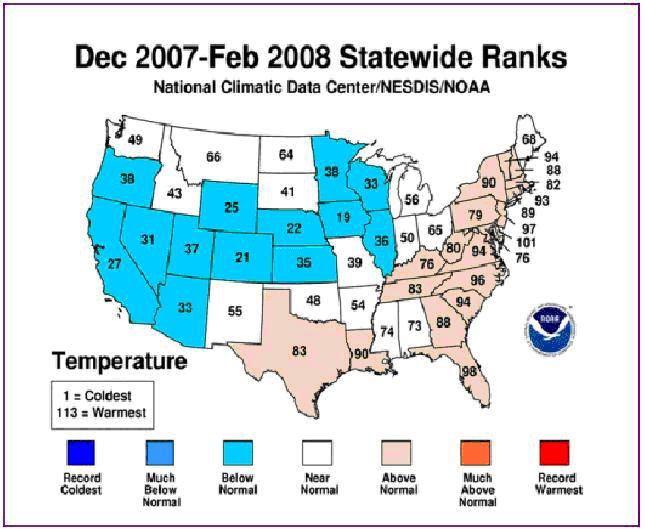
As indicated in the map, cooler Eastern Pacific waters bring cooler temperatures to the American West, indicative of a La Niña event. Consequently, the temperatures on the map along the West Coast and inland to the Rocky Mountains are colder than normal. Temperatures in the Eastern and Southern portions of the U.S. are mostly above normal – also typical of a La Niña event.
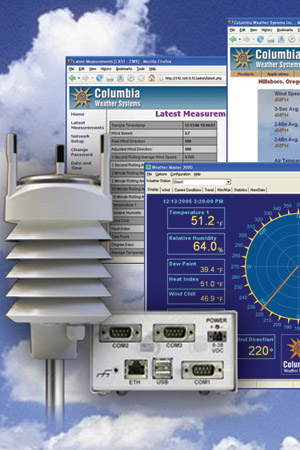
Hillsboro Case Study
Hillsboro, Oregon was used as the case study site for several reasons: 1) it is Columbia Weather Systems’ headquarters; 2) there is a complete data set from 2000 to 2008 logged from the weather stations here at the office; 3) historical climatic data for 30 years is available from the National Climatic Data Center (NCDC); and 4) the La Niña effects here along the West Coast were fairly dramatic.
September 2007showed the first La Niña indications when average temperatures went from 3.7°F above normal at mid month to -2.3°F below normal, a swing of 6°F. This trend carried over into the first part of October as a cool wet fall ensued. The latter half of October and the first part of November were unsettled, but temperatures averaged near normal.
In mid-November, a cold snap gripped the Pacific Northwest, plunging temperatures as much as 13°F below normal and issuing the season’s first snow event. Temperatures remained below normal for more than two weeks before a brief early December warming trend broke the cold snap. A second cold spell came on the heels of the first and sent temperatures well below normal again. The remainder of the month was again unsettled, but temperatures averaged near normal. December also had nearly two inches of precipitation above normal. All totaled, the fourth quarter of 2007, temperatures averaged 1.7°F below normal and precipitation was almost 1.5" below average.
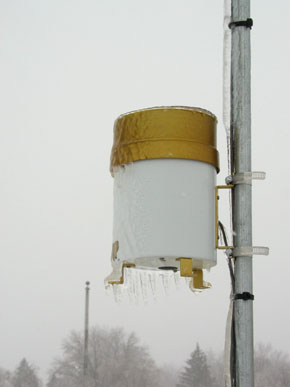
During the first quarter of 2008, temperatures started slightly above average for the first several days, but turned very cold for the next four weeks, as temperatures averaged -6.5°F below normal. Another cold event occurred during the last half of March. There were also several more snow events that occurred, which is very unusual for the Pacific Northwest. Mountain snows were at an all-time high in the Cascade Mountains, as roads were closed, towns were cut off, and roofs caved in underneath well over 10 feet of snow. Higher mountain areas received over 20 feet of snow in some locations.
January 2008 averaged -3.5°F below normal, but what was significant was the cold spell during the last 2/3 of the month that brought temperatures nearly -6.5°F below average and during the third week of the month, temperatures plummeted to almost -10°F below normal.
February 2008 started in the remaining grip of January’s cold spell. Then temperatures generally warmed and lingered mostly within a few degrees of normal for the remainder of the month. Monthly averages were -0.6°F, just slightly below normal. February was also the driest month of the season, receiving approximately half of the normal monthly precipitation.
March 2008 turned out to be the coldest month of the season averaging -4.4°F below normal. The last week of the month averaged more than -9°F below average where daytime highs reached only the low 40s and nighttime lows hovered near freezing.
Conclusions
What does all this mean? The textbook La Niña weather pattern experienced this past winter illustrates how ocean temperatures play an enormous part of our planet’s climate. A shift in ocean temperatures can change an entire continent’s weather patterns, bringing severe drought to some regions, extreme cold to others, hot weather to certain areas, and flooding to otherwise dry climates.
Ocean currents, on the surface and in deep fathoms, also change global climates. We are just beginning to understand the scope of these changes. They provide a plausible explanation why the polar icecaps are in such great flux, but studying ocean currents is a very complex science of topography, density, salinity, and other forces we may not yet understand.
Only within the last 50 years have meteorologists and climatologists developed a reliable global climatic data base. Prior to that, indirect evidence was used, such as tree rings and ice core samples. Other evidence used is ancient population migration patterns, and other indirect correlations.
Scientists worldwide agree that there are changes in our climate. Whether it be man-made, cosmic, or other forces in nature yet to be discovered, one thing is sure, the world’s oceans have a dramatic impact on the world we live in.
by John Gerrish, Certified Meteorologist
|