Weather Watching: Hurricanes 101
This year has been the most active and devastating hurricane season on record. What is this awesome force of nature?
Simply put, hurricanes are part of the earth’s mechanism of global heat transfer. The Earth is perpetually trying to reach a temperature equilibrium. In much the same manner as Arctic Outbreaks bring cold frigid and freezing temperatures to the subtropics in the winter, hurricanes transfer an enormous amount of heat to the northern latitudes in the summer and fall.
Latent Heat of Condensation
Hurricanes are known in different parts of the world as Typhoons, Tropical Cyclones, Willy-Willys, and Medicanes (Mediterranean Hurricanes). No matter what their name, the mechanism that creates these massive storms is known as the “Latent Heat of Condensation”. This is a process of transferring the sun’s energy, collected in the warm ocean waters, back into the atmosphere.
1. Water retains heat
The sun’s energy heats the earth. Land heats and cools faster than water – land also experiences more extreme temperatures than water. Conversely, water heats and cools more slowly and to less extreme, but the heat collected in water is more persistent and is retained longer. Oceans act as a heat collector, much like a solar panel, but on a global scale. Consider the fact that our world is three-fourths water and you get an idea of how much heat our oceans collect and exchange in a given summer.
2. Energy to change state
Water has three different states of mass: liquid, ice (solid), and gas (water vapor). Heating and cooling water is much different than air. Scientifically speaking, it takes one calorie of energy to heat (or cool) one gram of water 1° Celsius (C) - one gram is approximately .035 fl oz. This is true up and down the temperature scale, except when water passes through one of the changes of state – ice to water, water to gas, gas to water, or water to ice.
In these instances it takes more energy – much more – to change the water’s state, without changing its temperature. A pan of water takes only a few minutes to heat to the boiling point 212°F (100°C) and takes relatively little energy (heat). But when the water reaches the boiling point, it takes longer and much more energy for the water to boil at 212°F, creating water vapor (steam).
It takes one calorie of energy to raise the temperature of one gram of water 1°C. As the water temperature reaches 212°F it slowly converts from liquid water to water vapor, as evidenced by the bubbles that form at the bottom of the pan. In order to change the state from water to vapor, it takes an additional 540 calories of energy per gram to just change the water’s state without changing the temperature.
3. Condensation
Evaporation is a cooling process — it removes heat from its surroundings.
When a swimmer gets out of the water, the air flows over their body and removes heat to fuel the evaporative process of water on the skin. This is why the body shivers; heat is actually being removed from the body. This principle is also why evaporative coolers work well in dry Southwest desert areas.
Conversely, condensation is a warming process because heat is released back into the atmosphere as water vapor condenses back into liquid water. Rainfall is a good example of condensation. Hurricanes spread enormous amounts of rain over hundreds of thousands of square miles.
For this reason, hurricanes are fueled by the Latent Heat of Condensation. If it takes 540 calories to convert 1 gram of water to vapor, just think of how many trillions upon trillions of energy calories are generated by the enormous rainfall amounts hurricanes produce. It has been said that one hurricane produces enough energy to power the entire United States for a full year. If only we could harness this unbridled power of nature.
Development of a Hurricane
Most Atlantic hurricanes start as small disturbances off the West Coast of Africa. Created by weak atmospheric perturbations, these disturbances become Tufts, small clusters of thunderstorms. At those latitudes, predominant wind pattern is from east to west in the equatorial regions around the southern edge of the Atlantic High Pressure Cell. These winds are known as “Trade Winds.”
As Tufts move on the Trade Winds, they move out over warmer water, which starts the fueling process. Numerous Tufts develop and die over the course of any given summer; however, when upper atmospheric dynamics are just right, barometric pressure drops with the thunderstorm activity and any given Tuft can turn into a Tropical Depression.
Tropical Depressions are classified as storms with winds less than 38mph. Tropical Depressions form a cyclonic low-pressure center, which begins the organization process necessary for hurricane development. Tropical Depressions can also form in the Caribbean and/or Gulf of Mexico, as well.
When Tropical Depressions reach the warmer shallower waters of the Caribbean/Gulf of Mexico, their intensity usually increases. Tropical Storms are classified as storms with winds 38-73mph. Because of the proximity of the South American continent, the Trade Winds start deflecting more northerly out of the tropical latitudes. When this happens, the earth’s rotation influences the directional flow through Coreolis Force.
Coreolis is a spherical force which is caused by the curvature of the earth. The further north from the equator, the smaller the earth’s diameter becomes. This natural curve tends to deflect wind flow to the right in the Northern Hemisphere. Generally speaking, this is why the further north a hurricanes goes, the more it will re-curve its path towards the North and sometimes East. This is a primary reason why the United States’ Gulf Coast and Eastern Seaboard are prime targets for hurricane landfall. The dynamics, both atmospheric and geographical, are near perfect.
Hurricanes become a self-generating process when warm ocean currents reach 80°F or more. As long as hurricanes remain over warm waters, they will continue to regenerate themselves. Once a storm makes landfall, or moves over relatively cooler ocean waters, it becomes cut off from its energy source and rapidly weakens and dies.
If a weakened storm moves back over warm ocean waters, it may regenerate to be as strong, if not stronger, than it was previously. This happened with Hurricane Wilma – it weakened over the Yucatan Peninsula before it strengthened again and made landfall in south Florida as a strong Category 3 hurricane.
According to the Saffir-Simpson Hurricane Scale, there are five categories of hurricanes: Category 1 storms measure winds 74-95 mph; Category 2, 96-110 mph; Category 3, 111 to 130 mph; Category 4, 131 to 154 mph; and Category 5, winds greater than 155 mph.
Hurricane Season
As the earth rotates from winter to spring and summer, the days become longer and nights shorter. The Summer Solstice marks the longest day of the year – normally June 21. It’s also where the sun reaches its maximum tilt northward. This is known as the Tropic of Cancer (23.5°N) and runs through the Straits of Florida between Cuba and the U.S. mainland. After the solstice, the seasonal days get shorter and the earth’s apex to the sun slowly moves southward back toward the equator.
The Summer Solstice also roughly correlates with the start of the annual hurricane season. July and August are historically the warmest months of the year even though the days are getting shorter. This is, in part, because the atmosphere has been warmed by months of summer sunshine collected in the oceans and the lack of cold in the Polar Regions, which are now in constant sunlight. There’s relatively little cooling in the Arctic to counter-balance summer’s warmth.
As summer wanes into August and September, the Fall Equinox (September 21) signals that day and night are of equal length and the sun is directly back over the Equator. As the weather cools, Fall begins, but the oceans still team with massive amounts of heat energy collected over the summer. The potential for hurricanes exists as long as the oceans remain warm. October and November may produce devastating hurricanes as the oceans release their heat energy.
Components of a Hurricane
 |
courtesy photo
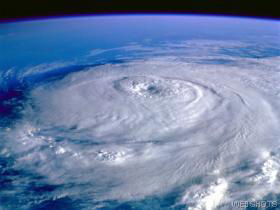
An average hurricane is about 300 miles in diameter, but larger storms can be as much as 500 miles across. In the Northern Hemisphere, these storms spin counter-clockwise, or from right to left.
|
The hurricane’s Eye is normally 20 to 40 miles in diameter, but can be much larger. Eyes are distinguished by relatively calm and clear weather in midst the maelstrom. At the edge of the Eye is the Eye Wall, which is the most intense and destructive part of the storm. Winds are their strongest and the storm surge can reach as much as 30 feet high or more, as what was witnessed with Hurricane Katrina.
Storm surge is caused by the extreme low-pressure in the Eye. The lack of atmospheric pressure allows the ocean surface to rise higher than the surrounding ocean. This rise in sea surface is whipped by the violent winds and creates massive violent swells. As the Eye Wall comes ashore, it encounters shallow coastal waters, which catapults the storm surge to greater heights.
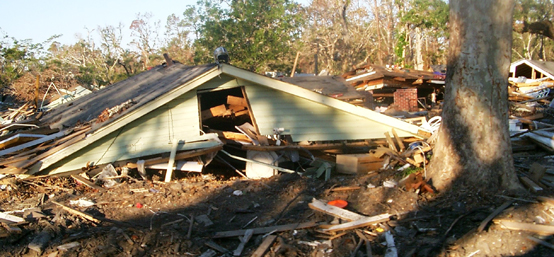
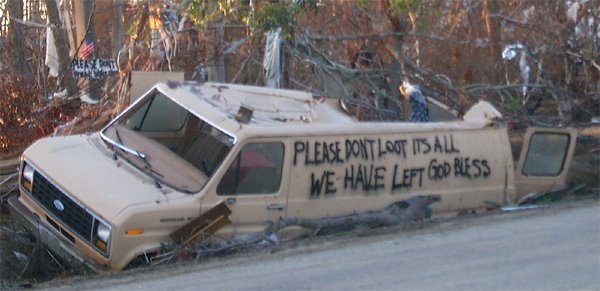
Storm surge is often the most devastating part of a hurricane and claims more lives due to the extreme flooding and violent forces of raging water. Low-lying areas become inundated with angry seas and the shear force of wind-whipped water turns sturdy homes into matchsticks. Katrina’s storm-surge caused catastrophic damage as the storm moved ashore. The hurricane’s eye passed just east of New Orleans, and brought an enormous storm surge into the Mississippi Sound, which breached Lake Ponchatrain. Levees broke and massive flooding inundated the city.
A hurricane’s right-front quadrant can be equally destructive, as it possesses severe Squall-Line thunderstorms, torrential rains, and deadly tornadoes in its spiral bands. Spiral bands also rotate counter-clockwise around the storm. They are the storm’s leading edge as it begins to make landfall. Katrina’s Eye Wall and storm surge actually made landfall near Bay St. Louis, MS, and literally destroyed the small coastal communities of Waveland and Pass Christian, among others. Here, the winds were estimated at greater than 140 mph and the storm surge was nearly 30 feet. The storm surge flooded many miles inland, leaving complete devastation in its path.
Theories
This was the most active hurricane season on record. There are many different theories as to why, some of which tie into the concept of Global Warming. It makes sense that if the oceans are warming and collecting solar heat, then the planet’s atmosphere will also warm as a result.
Another theory, which also makes sense, is the earth moves and rotates in cyclic patterns: day to night, season to season, year to year. The earth also has a 22-year solar cycle where the earth reaches it’s solar maximum every 11 years then rotates to a solar minimum 11 years later. In the year 2000, we reached our “Solar Max”. In the years leading up to the 2000 Solar Max, weather records indicated an increase in global temperatures, which seems natural. We also saw a greater activity in the El Nino and La Nina oceanic patterns.
These anomalies affect and change global weather patterns, as well. In the 1980s, the meteorological mantra was “The Next Ice-Age”. This was a period when the solar cycle was approaching it’s minimum and the earth and oceans were experiencing relatively cooler temperatures. Cooler oceans would indicate slower hurricane seasons. Only time will tell how these cyclic patterns truly affect the earth’s climate and hurricane cycles.
Tracking the Storm
Today’s world is much more technically prepared to warn its citizens of a hurricane’s approach. Satellite imagery and Doppler Radar provide ample warning days in advance.
The famous Hurricane Hunters fly C-130 aircraft missions through hurricanes to collect and provide critical weather information. Radiosonde data – weather instruments with a radio transmitter are dropped from the plane at regular intervals to paint a vertical cross-section of wind, temperature, pressure, and moisture contained in the storm.
This information gives scientists at the National Hurricane Center in Coral Gables, FL much needed data to plot and forecast a hurricane’s development and projected path. Their forecasts have saved innumerable lives through the years. They also provide emergency managers advanced warning and landfall projections to allow the necessary time to pre-stage and stockpile water, food, and other emergency supplies. They also give the public and businesses adequate time to board up and secure their buildings and belongings.
Hurricanes are the most dynamic and destructive of all atmospheric storms. They are also an integral part of the planet’s heat exchange. Without them parts of the northern latitudes would be uninhabitable.
We cannot stop hurricanes, so we must learn to get out of their way. Advanced warning is the most crucial part of the mitigation process, and learning more about these dynamic forces helps us to better understand and contend with nature’s most devastating storms.
John Gerrish, CWS’s Sales Manager and Certified Meteorologist, assisted hurricane relief efforts at his local church which provided the photos.
return to top
|