Price Quotes
1 888 508-7375
Email
|
|
 |
Summer 2001
|
|
Weather Watching:
Foretelling Weather Conditions
|

by George Miller, Consulting Meteorologist
|
|
The following appeared in the Oregon City Argus on March 28, 1857: "Mr. Meriam, the distinguished meteorologist of Brooklyn, who for many years has taken hourly observations on the thermometer and barometer, now adds his testimony. He says, 'With all my practical experience in observing atmospheric changes, and recording hour by hour and day by day thermometrical and meteorological observations, and connection with simultaneous observations made and recorded elsewhere, I feel more and more convinced that it is not in the power of any human being to determine, even a single day in advance, what changes will take place in the atmosphere.'" I only wish Mr. Meriam were alive today.
So much has happened in the understanding of our atmosphere since 1857 that meteorologists can, with increasing accuracy, determine more than a single day in advance what the weather will be. How do they do this? I remember one of my professors telling me in the late '50s (that's the 1950s for you skeptics) that within 25 years all forecasts would be made through a numerical understanding of the weather. He was a bit ahead of his time, but he was close.
The atmosphere operates on a series of equations, or laws of physics. No, you won't be bored with their derivatives in this article. I have long forgotten the equations of motion, conservation of energy, etc. I struggled through those classes at the University of Washington, eager to begin using my synoptic meteorology to forecast the weather. But my synoptic (using the weather map and my local knowledge) meteorology soon failed me.
Projecting that small air parcel forward in time
If the atmosphere operates on equations, then mathematically those same equations can be projected forward in time. (Calculus and differential equations! Brrrr! The sound still scares me!) But first, the initial state of the atmosphere must be measured. Some of you may be doing that already. Thousands of observations of the weather are collected locally at many locations and most are relayed in some manner to the big computers in Washington, DC. that are operated by the National Weather Service. These computers digest the data and project a parcel of air forward in time.
If you have a tile floor with a square pattern to it, imagine an observation at each corner. Then, imagine several layers of tile, one on top of another to the "top" of the atmosphere. That is how a computer looks at these observations that are measured by radiosondes, satellites, remote observing systems, radar, and even manually.
At each one of these points, in three dimensions, the computer generates a value. Then, through those laws of physics that I have forgotten, the computer projects that small air parcel forward in time, raising it, lowering it, adding moisture, changing its speed, etc. The computer does this in very small steps. It is called numerical forecasting.
The results are what meteorologists call "forecast charts." These charts are what the surface isobar pattern, the winds aloft pattern, and the moisture content of the air should look like in 12, 24, 36, etc., hours. Now, just as your home computer has increased its ability to contain data and make calculations over the last ten years, so have these big computers in Washington, DC. And, the bigger they get, the better they get. Most of the time now, it is hard to beat their predictions, even out to ten days.
BC: Before Computers
It's hard to believe, but as early as the 1920s meteorologists were thinking along the lines of numerical weather forecasting. But with computers? Well, no. A man by the name of E.F. Richardson envisioned a large room full of meteorologists, each with a slide rule. (For the under 30 set, check your dictionary for definition of a slide rule.) Each meteorologist would make a calculation and pass that along to the person sitting next to him. Oh, can you imagine the state of the atmosphere if that person was on a coffee break??!! Mr. Richardson's idea was right, but he was living at the wrong time. He should be alive today to see how far numerical weather forecasting has advanced.
Twenty years ago a ten-day forecast would have fallen into Mr. Meriam's camp. Not today. Computers are able to foretell the major changes that occur in our atmosphere from cool, cloudy and rainy weather to warm, sunny and dry weather. Today's 48-hour, or two-day forecast is as good as the 24-hour or one-day forecast was 20 years ago.
And now, when you watch the weather people on television, they do not hesitate to go out five days and more with their predictions. Yes, I know. You still hear the forecast of, "Partly cloudy with a chance of showers!" But that's another topic.
|
|
| return to top |
Wine Grape Growers Assoc.:
Optimizing Weather Monitoring Value
 
|
|
Wine grape growers are among a rapidly-growing, high-value agricultural market that relies on local, site-specific monitoring of meteorological parameters.
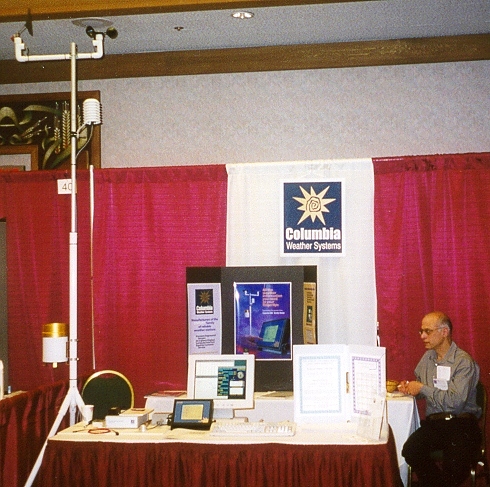
In February, Columbia Weather Systems exhibited at the Washington Association of Wine Grape Growers conference in Pasco, Washington. As our first trade-show in the wine grape growers market, our main objective was to learn about the market, its requirements, and how we can use the Capricorn weather stations to meet those needs.
We were delighted to meet a lot of growers and to see that there is a high level of interest in local weather monitoring.
We were also pleased to meet some growers who have our weather stations such as Bob Brown from Canoe Ridge Vineyards. We had the opportunity to answer customer questions and make them aware of system capabilities to help them optimize the value of their weather stations.
Getting the Most from Your Weather Station
Many of our customers in this industry use our weather stations as part of a forecast network through ERF Company. They have the EWIN III version of our Capricorn 2000 weather station. The customers locate the weather station on their site and ERF polls it regularly to gather data for forecast modeling. ERF provides localized forecast information directly to the grower. Many growers didn't realize that they can access their own current data as well.
Capricorn 2000 (and EWIN III) weather stations have two RS232 ports. The ERF modem uses one of these ports, the other is available for the customer to access their on-site weather data for display on the Capricorn 2000 Display Console or on a computer with weather software for display, database and analysis.
Current on-site weather data is important for worker safety, application of chemicals, and many other uses. In addition, the user can set alarm conditions and be alerted when temperatures drop above or below a certain point, wind speeds reach a certain level, or any number of additional alarm parameters.
Growing Degree Days
One of the main parameters that we were most asked about is growing degree-days. Generally, degree-day is a measure of the departure of the mean daily temperature from a given standard: one degree day for each degree (°C or °F) of departure above (or below) the standard during one day. Degree day accumulation is used primarily as a tool for pest and disease modeling and control.
Degree days are accumulated over a "season" at any point during which the total can be used as an index of past temperature effect upon some quantity, such as plant growth, pest and disease emergence, fuel consumption, etc.
In agriculture, degree-day is referred to as growing degree-day. The base temperature is dependent on the type of crop or pest and disease.
Using the Capricorn 2000 weather station, degree-day is calculated using the Weather Display console (Ag Edition) and/or WeatherView 32 software.
In WeatherView 32 weather station software, degree-day is displayed in the NOAA style monthly report shown below:
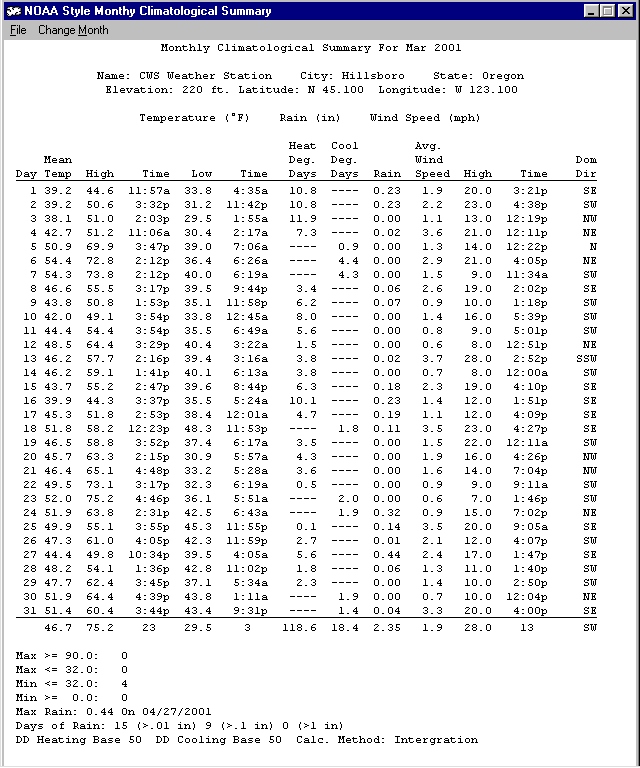
The report displays daily mean, high and low temperatures and their time of occurrence, heat and cool degree day, rain amount, average and high wind speed and direction. The report also displays additional temperature and rainfall statistics.
The Agricultural edition of the Capricorn 2000 Weather Display is designed to calculate complex parameters such as evapotranspiration and degree days to help farm and vineyard managers make decisions affecting agricultural operations.
The Weather Display unit displays degree day for the day, degree day for yesterday and degree day accumulation.
The user can set the starting day for the accumulation and the base temperature. The user will also be able to look up the degree day accumulation between any two dates in the year.
In order to have all the information needed for ET and DD calculations, the Ag Edition Display requires a Capricorn 2000MP with solar radiation sensor. Contact us for upgrade information.
|
|
| return to top |
Maximize Water Usage with Soil Moisture Monitoring
Information provided by Jack Hillen, President, AquaPro Sensors
|
|
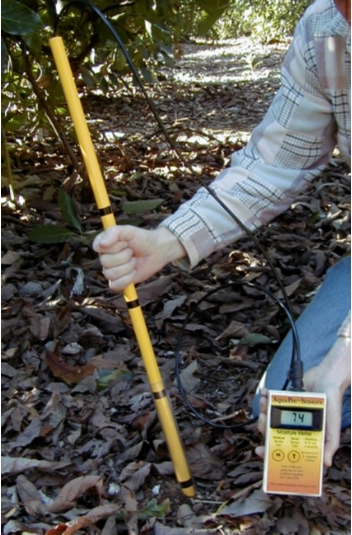
Portable Probe and Moisture Meter. Black bands are depth markings.
As everyone knows water is the most precious resource in agriculture. And, like other scarce commodities, its price goes up and up each year. Add to that the energy costs involved in getting water to your crops, and it becomes apparent that gone are the days of guessing how much to irrigate. Who, especially in the arid West, can afford to continue with the age-old method of "better safe than sorry", where you drench everything just to be sure the plants are getting enough? No, those who want to stay in the business (and it is a business after all) need to focus on precision management; not the least important element of which is water management.
For cost-effective water management, Columbia Weather Systems offers AquaPro brand soil moisture sensors.
For general monitoring and data logging the Direct Burial Sensor can connect to the Capricorn 2000MP weather station. It is permanently installed directly in the soil.
This sensor can also be used to help automate irrigation with the the AquaPro Moisture Controller. The Moisture Controller runs on 24 volts AC and can control up to 5 solenoid valves. A dial allows the user to set the moisture level they wish to maintain. When the water penetrates to the level of the sensor, it will turn the water off, and when it dries out beyond the point you have set, it will turn the water on. One sensor and one controller are all that is needed per irrigation block.
For monitoring moisture levels in several areas throughout your property, the AP Portable Probe is a handheld capacitance sensor. It is inserted into access tubes, which are installed permanently in the ground, and gives continuous digital readings (not preset levels) from the surface down to any root depth. The readings are displayed on a large LCD on the Moisture Meter, which is a handheld microprocessor that converts the sensor's signal into an easy to understand percentage, where 0 percent is bone dry and 100 percent is saturation with accuracy of +/- 1 percent. The Moisture Meter runs on a standard 9volt battery, which powers the portable probe and is also used to calibrate the probe to your specific soil.
The access tubes are specially extruded polycarbonate tubes 1-meter long and 1-inch in diameter. The bottoms are sealed, and they come with caps to keep out rain and irrigation water.
Installation of the access tubes is very simple, and anyone can do it in about 10 minutes. An auger is supplied with the basic start up package to make holes up to one meter deep, as the standard tubes are one meter long. Bore a hole to the depth desired, and then fill the hole about halfway with water. Next, use the auger to mix in soil, the same as what came out of the hole, until the hole is filled with mud the consistency of wet cement. Insert the access tube into the hole so the mud oozes up around it to form a nice solid contact. Since the tube is in saturated mud, insert the probe into the tube and calibrate it by pressing two buttons on the Moisture Meter. The probe knows what 0 percent is from the factory settings, and now it knows what 100 percent is for your soil. This is the only calibration necessary and it is stored in the sensor's permanent memory; now the rest of the tubes can be simply installed.
The AP Portable Probe is a very user-friendly system, and it is also very economical. The complete start up package sells for $749.95 and includes10 access tubes. This gives you ten moisture monitoring stations, each 1-meter deep, for about the cost of a dozen tensiometers. All you need is one probe and one meter for as many locations as you want to measure, and you can quickly get a complete moisture profile of your entire root zone.
These sensors are excellent tools for those who don't want to invest thousands of dollars and/or have technicians advise you when you should water. The power and the knowledge are in your hands, because the more you know, the more you grow!
|
Cap 2000 Display Adds Aviation Edition
|
|
The Aviation Edition of the Capricorn 2000 Weather Display is designed to give pilots and airport operators more than just standard environmental conditions such as temperature, winds speed and humidity.
This new weather display provides disperse-relevant information to help pilots take off and land. It provides complex calculated parameters such as density altitude which is particularly useful for high elevation airports. It also displays additional wind speed and direction charts.
Density Altitude
Density altitude is a meteorological variable that is important to pilots, especially during the summer. The density altitude is the altitude in a standard atmosphere where the density is the same as the given atmospheric density. During a hot muggy summer day, a pilot begins take off from an airport with an elevation of 2500 feet. Because of the warm temperature and the moisture in the air, the airplane has to work as if it was taking off at an airport at an elevation of 6000 feet resulting in the plane needing more power and a longer roll down the runway to take off.
Prevailing Wind Chart
This chart shows the wind direction for the last hour. This chart is useful in determining the prevailing wind for the last hour.
Wind Run Chart
This chart shows the direction and distance the wind has traveled in the last hour. The scale of the chart and units are displayed at the bottom of the chart.
Wind Average and Gust Calculations
In the Aviation Edition, the user has the flexibility of defining the interval for the wind speed average. The available range is from 1 to 60 minutes.
Similarly, the user can also define the interval for the wind speed and direction gust. The available range is from 5 to 60 minutes.
|
|
Conference Report: Wash. Assoc. of Wine Grape Growers
|
|

by Michael Fagin
As mentioned on page 1, Nader and I had the good fortune to attend the yearly convention of the Washington Association of Wine Grape Growers. Besides the great food and Washington State wine, this convention was very informative.
We had a steady stream of traffic at our booth and were only able to get away for one workshop "What Our Future Looks Like: Evolving Computer Technology for Wine Grape Production." This covered the technology that one could use to analyze crop production including GPS instruments, satellites, and weather monitoring equipment. One of the major points was that 20-30 percent of the vineyard will yield 70 percent of the profits. This is why it is so critical to gather detailed data throughout the vineyard.
Most of us know that air temperatures can be significantly different between north and south-facing slopes, but I have some interesting statistical data to back that up. For a reference point we are looking at a 30-degree slope on June 21 and measuring solar radiation units. The south-facing slope receives 1200 units of solar radiation from 10:00 am till about 2:00 pm. The north-facing slope will receive only 800 solar units from 8:00 am till about 2:00 pm. The north-facing slope receives about 33% less solar radiation than the south-facing slope. Some interesting numbers.
Many conference attendees were interested in real time weather information available on Washington State Internet locations. There are many sites: Public Agricultural Weather Systems (PAWS) is a fee based system with lots of detail. The Bureau of Reclamation Agrimet-Hydro Met stations and Washington State Department of Transportation also post weather data.
Columbia Weather Systems is considering a web site that would contain real time weather information from some of our many agricultural customers. The site could contain relevant weather data for selected vineyards such as growing degree days, evapotranspiration, dewpoint, temperature, wind, rain, highs and lows, and relative humidity. We will keep you advised of these developments. Please contact us if you would like to participate.
Michael Fagin, field representative for Columbia Weather Systems. You can visit his Washington Online Weather web site at washingtononlineweather.com.
|
Capricorn II and II Plus: First Price Hike in 10 Years
It has been about 10 years since we've raised prices on the Capricorn II and II Plus weather stations. During that time, inflation has increased steadily and the cost of components has increased dramatically. The Capricorn II and II Plus remain, however, very popular in our Capricorn line of reliable weather stations.
To make these products cost-effective for us to manufacture, we are obliged to raise their prices. The base price for Capricorn II Plus will rise to $1862 and the Capricorn II will be $1520. For an updated price schedule, please contact us.
|
|
|
|
